A Silver Lining? How COVID-19 Lockdowns Improved Indore’s Air Quality
June 24th, 2021 | viewpoint
For the last two decades, air quality in Indian cities has been deteriorating. This has increased health problems such as respiratory infections, cardiovascular diseases, and asthma incidence and severity. As recently as last year, experts in the country questioned if any regulations or policies could ever combat the lethally high level of pollution. “Environmental pollution is an incurable disease, it can only be prevented,” famous ecologist Barry Commoner once said. However, is it really true that nothing can turn the tide on this major health emergency? Taking the lead from recent global studies, the Building Healthy Cities (BHC) project used openly available data to assess trends in air quality before and during the recent COVID-19 lockdowns in Indore to see if this natural experiment can provide any insights.
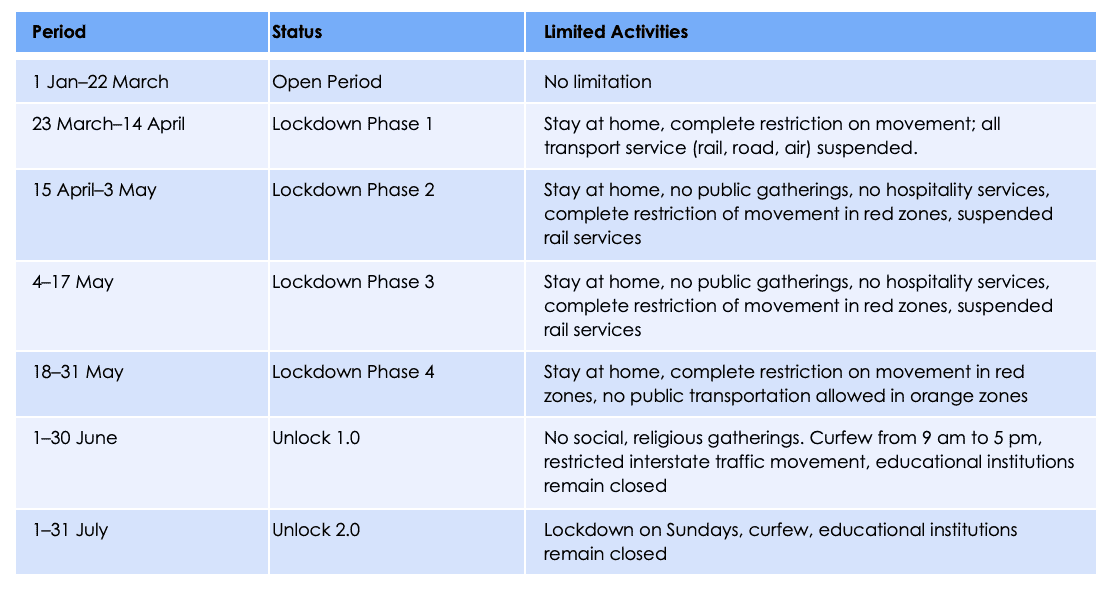
On March 25, 2020, an India-wide 21-day lockdown went into force due to COVID-19 and was extended until May 31 due to increasing cases. From June 1, 2020, onward, individual states started easing the restrictions in phases and some imposed partial lockdowns depending on positivity and case fatality rates. Some district authorities marked areas with high caseloads as containment zones, with restrictions to be maintained until cases reduced.
In Indore, a thriving city in the state of Madhya Pradesh, the first case of COVID-19 was reported on March 26 and the number of cases began increasing rapidly. The district administration implemented stricter guidelines, forbidding citizen’s mobility except to provide or obtain essential services. On April 16, the second phase of the national lockdown began. In this phase, the government classified areas by zones with “red” indicating the presence of infection hotspots; “orange” indicating some infection; and “green” indicating no infections. Indore was classified as red and stayed in lockdown through Phases 3 and 4. The table below details the phases of the lockdown and corresponding limitations in Indore.
While the lockdown was not aimed at improving air quality, the related restrictions on transport, industry, and other activities seemed to improve air quality during this time. This natural experiment provides lessons on aspects of lockdown that could be adapted to improve longer-term air quality in Indore and similar cities. This study also shows the potential value of real-time, openly available air quality data for tracking relative levels of air pollution to inform policy and municipal decision-making.
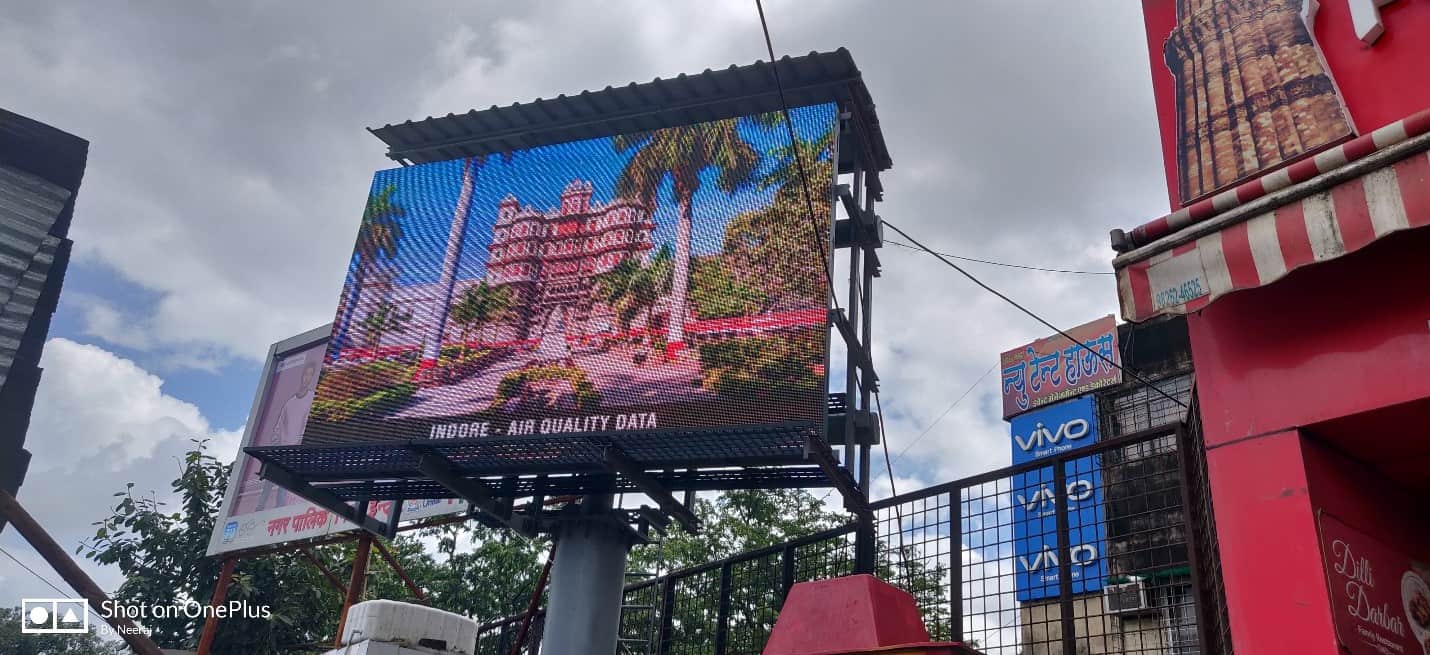
BHC used data collected by the Madhya Pradesh Pollution Control Board’s (MPPCB) reference monitoring station at Chhoti Gwaltoli. We choose this station because it is located in central Indore city; is operated by the MPPCB, which ensures its reliability and accuracy; and collects readings in real-time. This is important because like the weather, air quality can change from month to month and even hour to hour. These data are available via OpenAQ, a worldwide database of high-quality data collected by government agencies. This resource is focused on openness and transparency and can be accessed by anyone, including residents, interested in Indore’s air quality. For this analysis, we grouped the PM2.5, CO, NO2, and other pollutant data based on each shutdown stage. We chose these pollutants because PM2.5 is often related to traffic and construction dust, and the gases nitrogen dioxide (NO2) and carbon monoxide (CO) are related to fuel combustion (e.g., vehicle and airplane exhaust).
Our descriptive analysis found that:
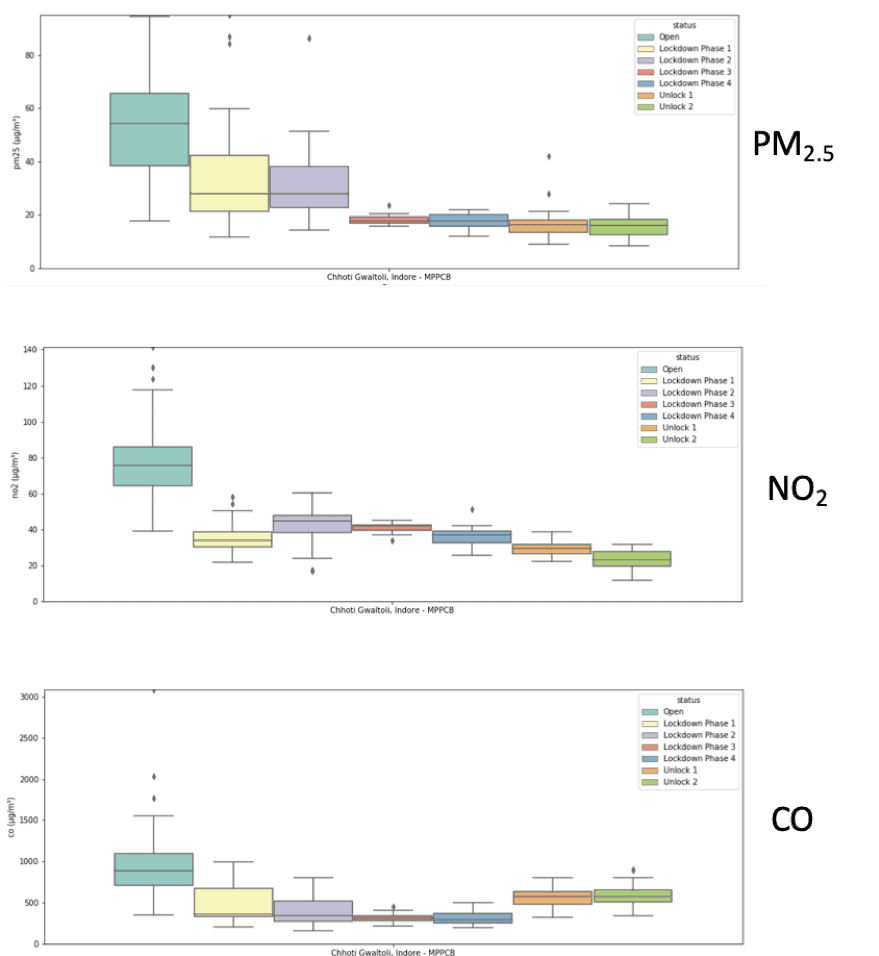
Our analysis echoes findings in other Indian cities and cities throughout the world: major air quality improvement is possible with drastic reductions in activity. But what can we learn from this information? Is it possible to make long-term reductions in air pollution without such draconian restrictions? There are some key takeaways that can inform local air quality policies. The first is that these air quality improvements demonstrated that one way to achieve “cleaner air” is by cutting emissions at the source. Many of the sources of pollution in Indore are from transport (including road dust), domestic cooking and heating, and open waste burning. Finding alternative, cleaner solutions for these daily issues can drastically cut emissions without “locking down” citizen’s access to transport, cooking, and waste elimination.
A 2017 analysis by BHC and the city observed declining trends in PM2.5 and PM10 since 2015, possibly due to various measures taken by the Indore Municipal Corporation (IMC) and Indore Smart City Development Limited, such as increased street sweeping to reduce dust and changing traffic patterns to reduce idling. Indore is also considering options like infrastructure upgrades for bikes and pedestrians. The city may want to consider how more widespread remote work policies could reduce vehicle emissions, and how zoning could facilitate safer pedestrian access to commercial areas.
Regarding cooking emissions, BHC found good coverage of “clean” liquified petroleum gas (LPG) cookstoves in a 2018 ISCDL/BHC Survey, but our qualitative data in 2019 found that people in slum areas had problems signing up for LPG subsidy program because of complications in the application process, and refills were expensive. Many still use a mix of LPG and other fuels. More education and incentives can be provided to make this clean cookstove program effective for the poorest households. Finally, IMC has made great strides in increasing the circular economy for waste in Indore, but more can be done in low-income areas to change dumping and burning behaviors, and the timing of waste services could be adjusted to better allow day laborers to use them.
This study was conducted on open access, real-time, local air quality information. This information allows researchers, government officials, and the public to observe air quality changes in their own communities. To promote ownership of local data and help citizens understand local air quality, BHC is deploying a network of low-cost PM2.5 sensors in several Indore neighborhoods. This is part of BHC’s larger efforts to empower citizens and increase data-driven decision-making for healthier cities. We hope results include a better dialogue between cities, sectors, and residents on how to make Indore a healthy, more liveable city for all.
We strive to build lasting relationships to produce better health outcomes for all.